Financial Market Analysis Platform
Dashboards
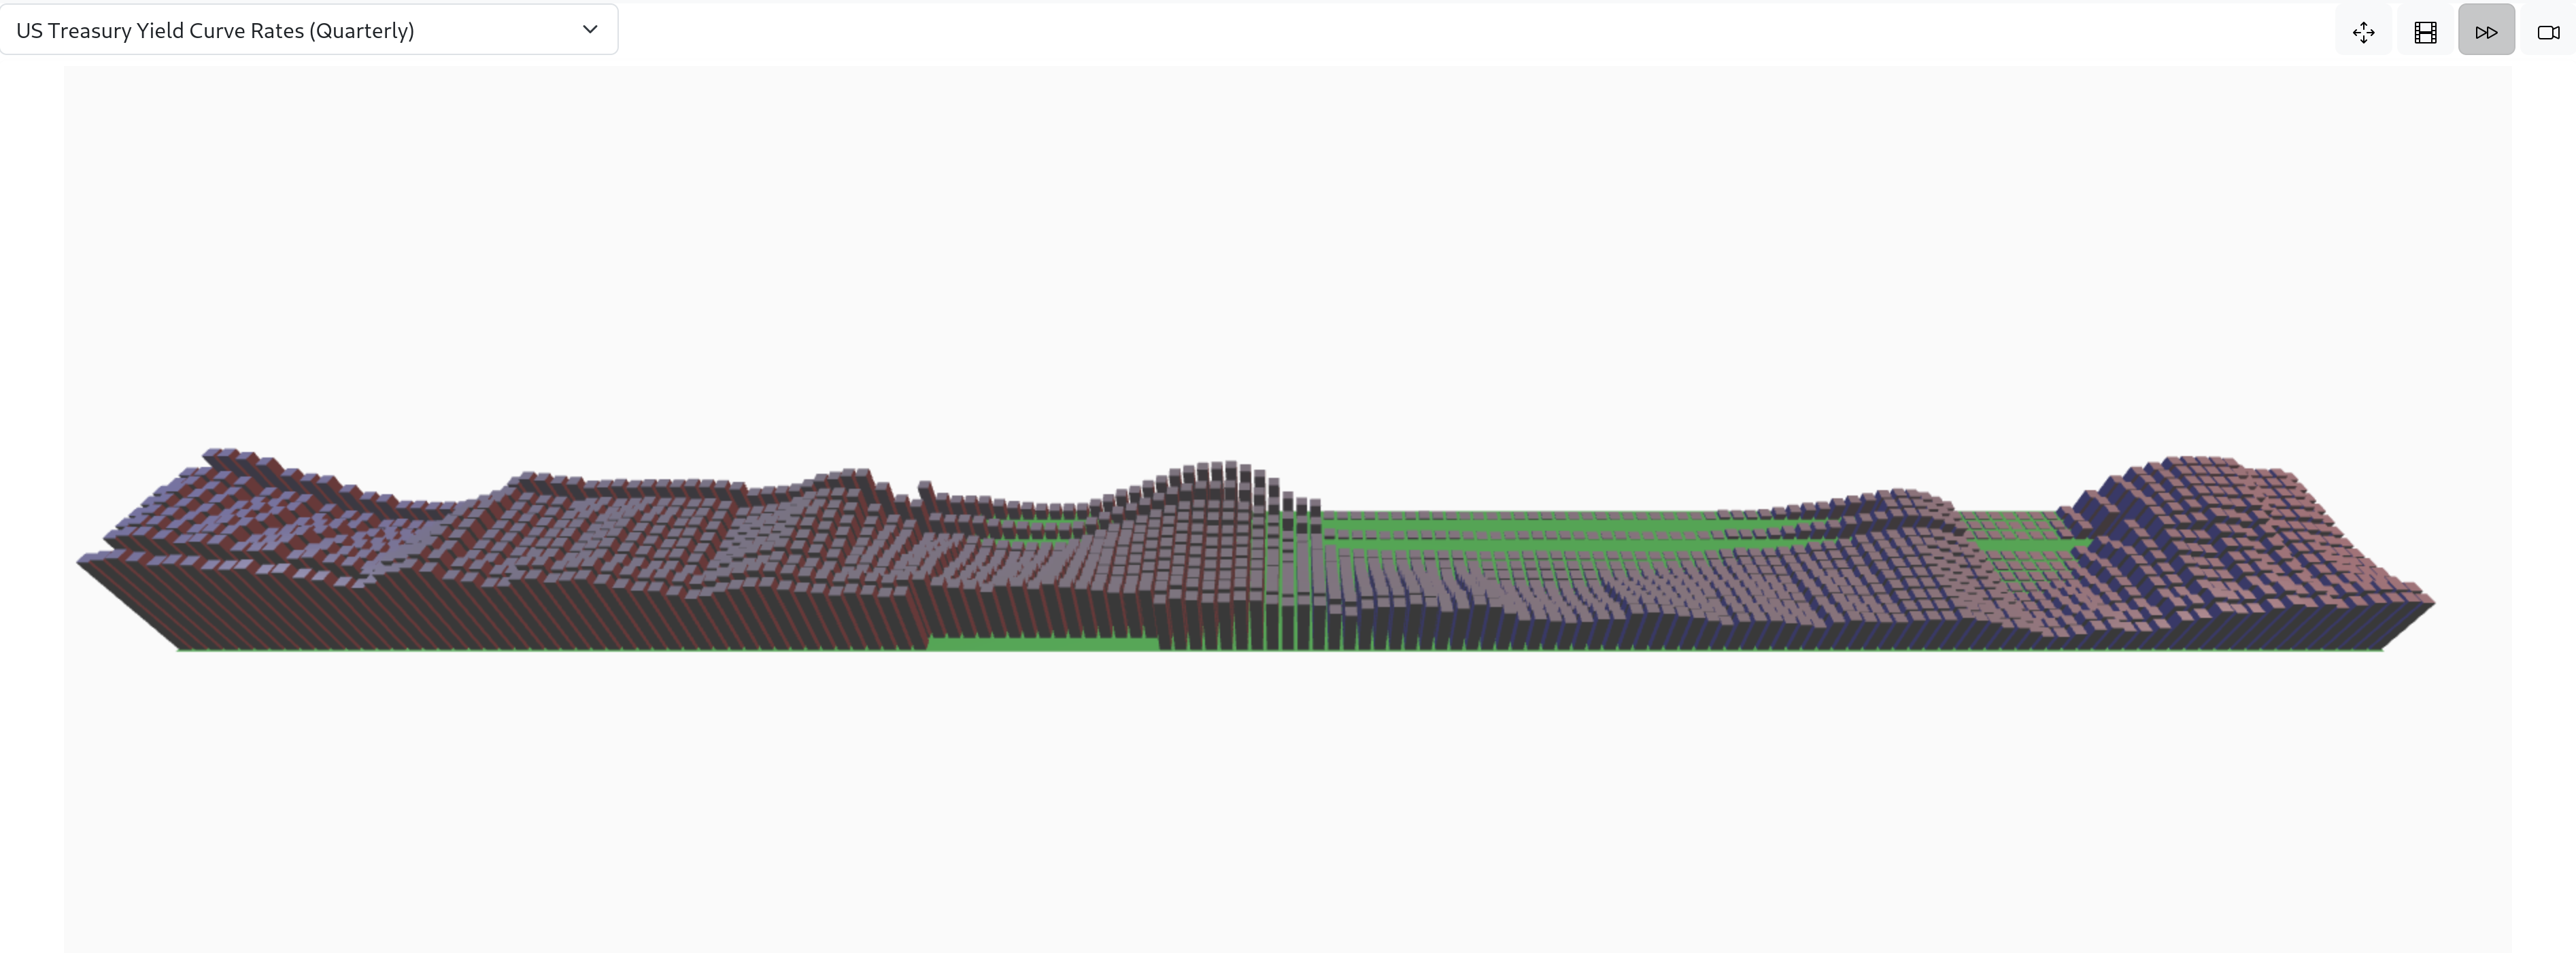
Interactive Yield Curve 3D Surface
The ByteZoo.com platform provides analytical tools and data visualizations to help investors assess current market and economic conditions. The platform includes the following services:
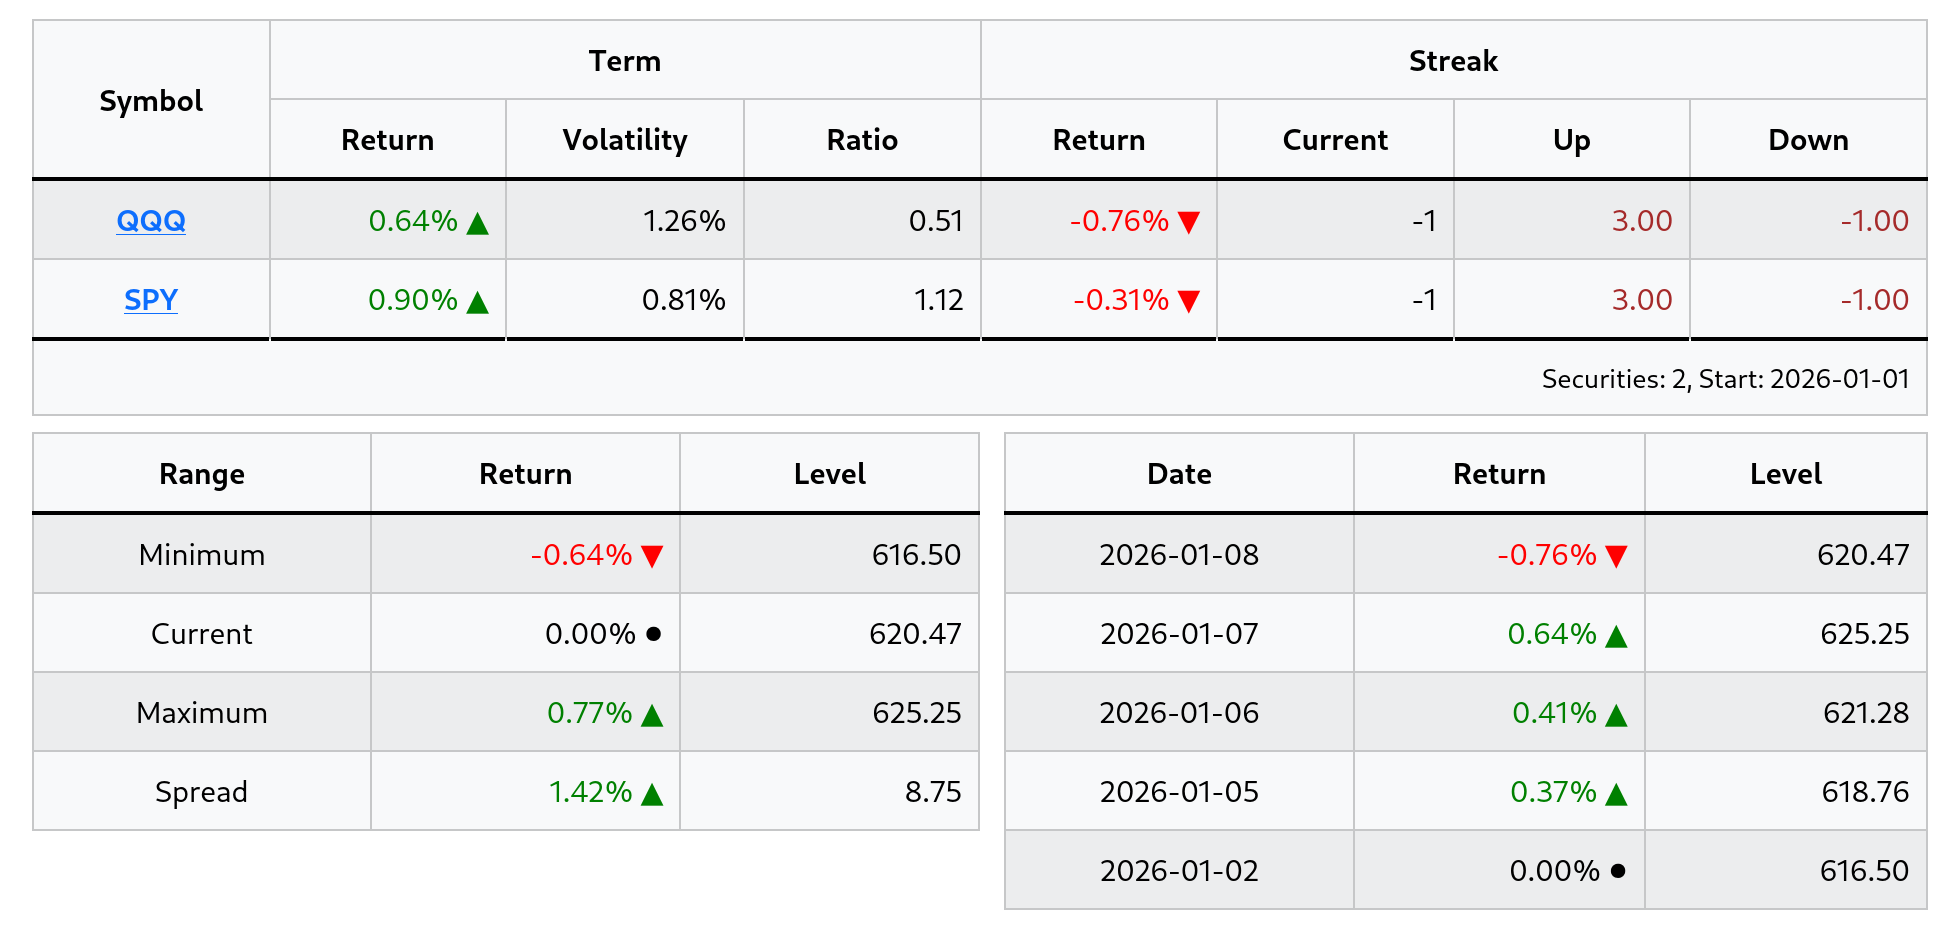
Dashboards: Interactive dashboards presenting key metrics and analytics for common equity stocks, ETFs, and major market indices. These include performance data, valuation metrics, and market statistics in a consolidated format.
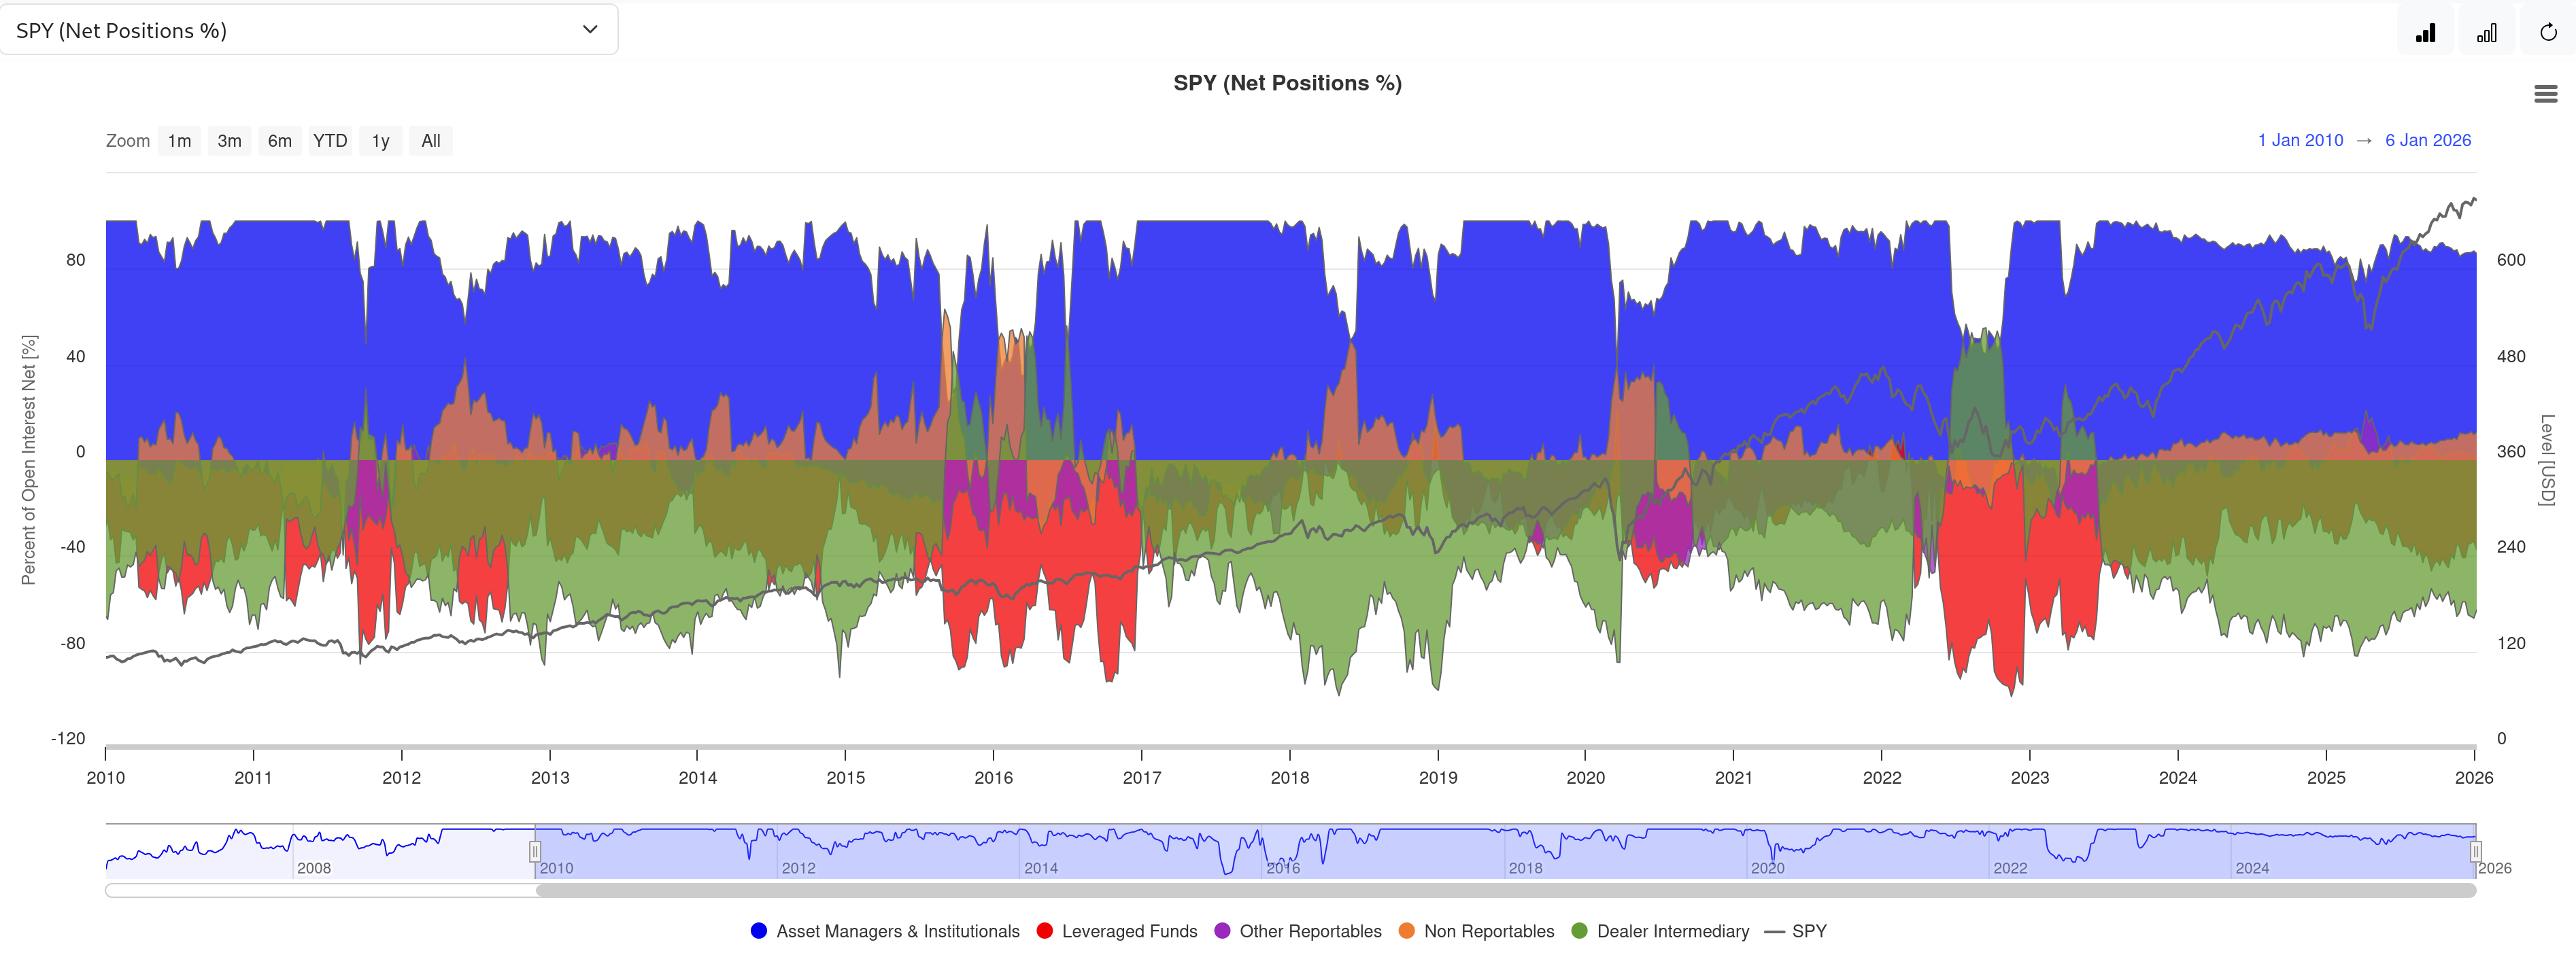
Charts: Visual analysis of current market conditions, including performance and positioning data across major asset classes such as equities and commodities. These views also track the activity and exposure of different market participants including asset managers, institutional investors, leveraged funds, and broker-dealers.
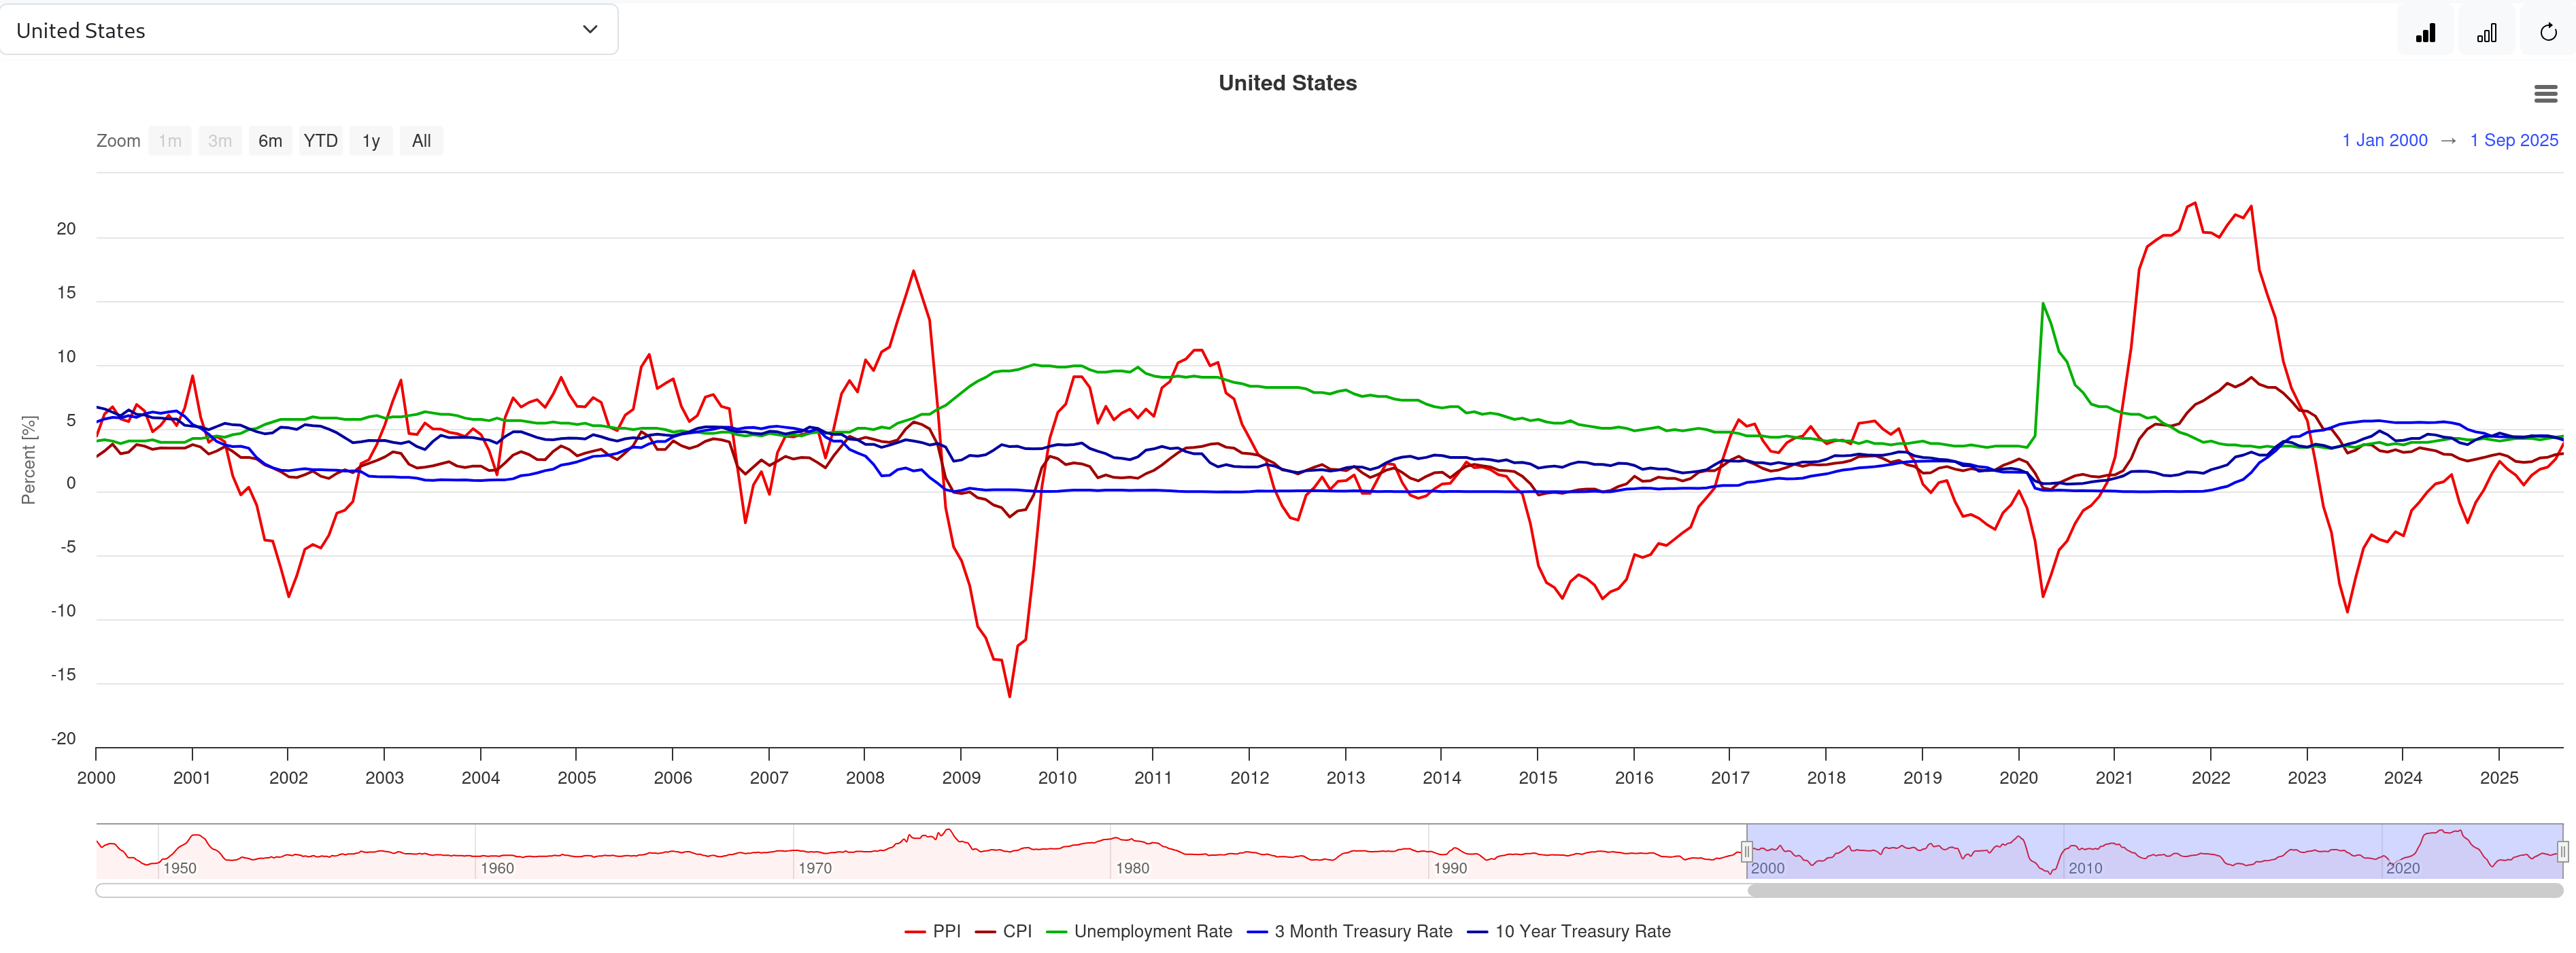
Economic Conditions: Comprehensive view of macroeconomic indicators with both current readings and historical trends. Key data series include inflation measures, employment figures, and monetary policy decisions to help understand the broader economic environment.
Interactive Yield Curve 3D Surface: Detailed US Treasury yield curve 3D visualization allowing analysis of term structure across maturities. Historical yield data helps identify long-term trends in government policy and shifts in market expectations for interest rates.
Charts
Economic Conditions
Questions?
Contact us on LinkedIn